Your critical resources.
On ONE dashboard.
Not sure how LoRaWAN works — or why it costs what it does?
Most people arrive thinking it's a simple Wi-Fi sensor. It isn't. LoRaWAN is a purpose-built long-range radio network — the global standard for serious remote monitoring. We wrote a plain-English guide that explains exactly how it works, why the gateway is the real infrastructure investment, and why it's the right choice for farms, reserves and remote operations.
We integrate ANYTHING
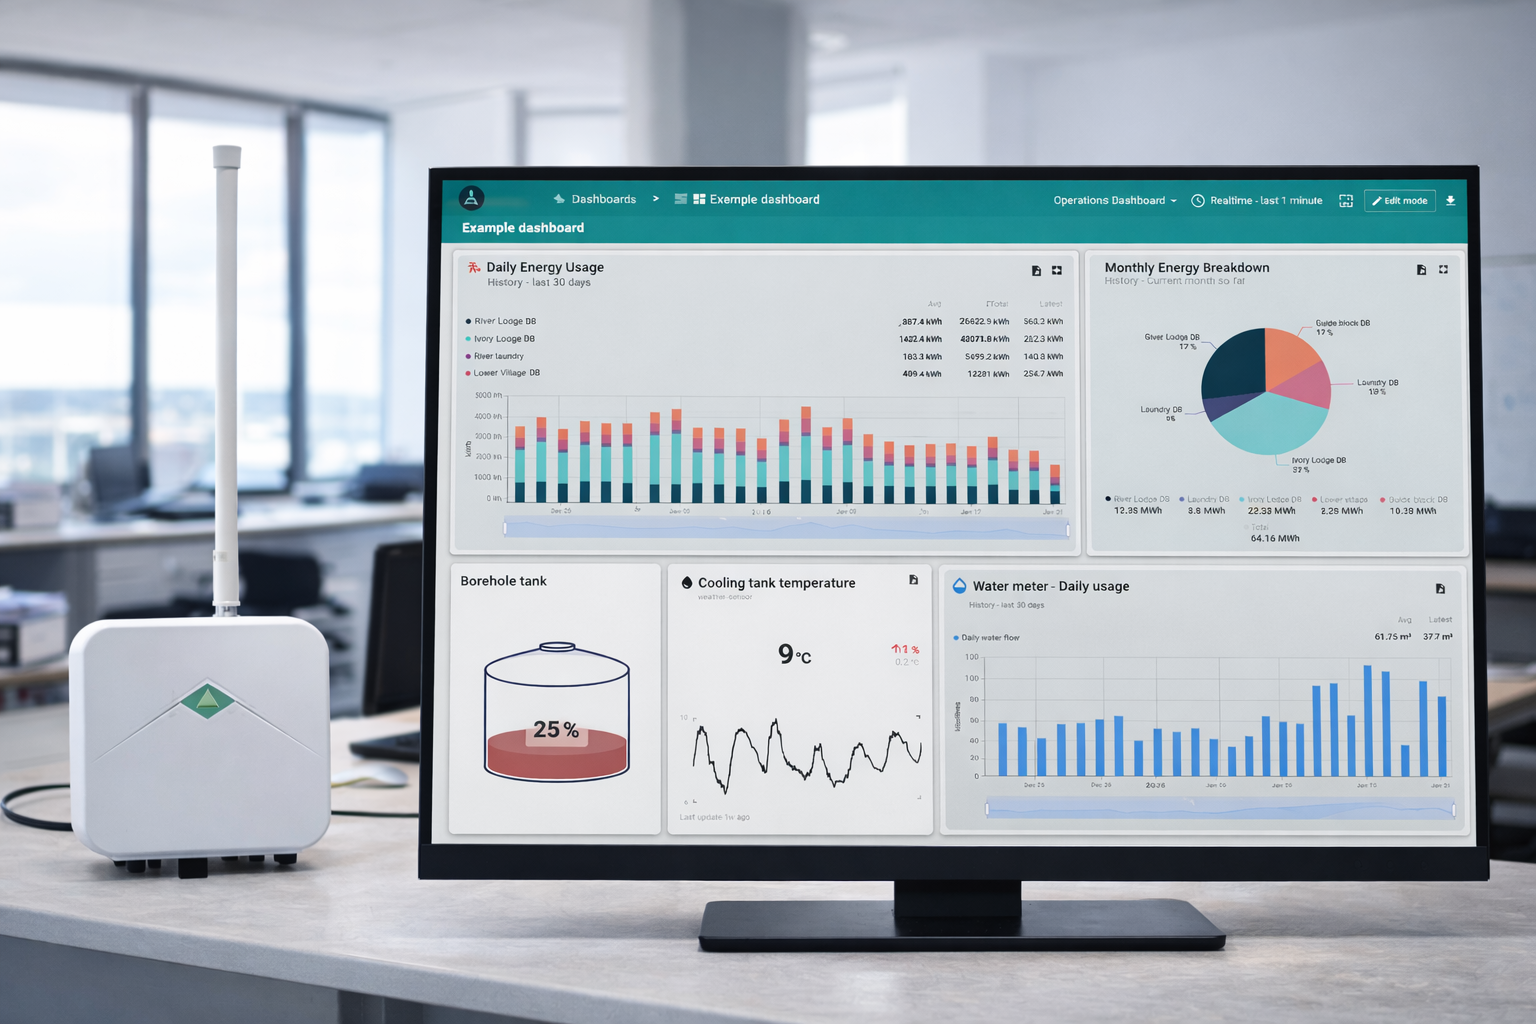
Your entire operation. One screen.
Not a fixed template — a dashboard custom-configured for your exact infrastructure, laid out the way your team thinks about your property.
Automated reports, every month
Your site's full story — in your inbox, on schedule. No spreadsheets. No exports. No chasing.
Every Wild Data system includes automated reporting as standard. Each month you receive a professionally formatted report covering your full site — water consumption trends, tank behaviour, borehole performance, solar yield, energy usage and any anomalies flagged during the period.
The kind of report you'd share with a lodge owner, a board, a property committee or a facilities director — generated automatically, without any effort on your part.
- Monthly reports included as standard with every system
- Flexible scheduling: weekly, monthly, quarterly, or custom
- Covers all monitored systems in one report
- Anomaly flagging — tells you what changed, not just what happened
- Usage trends and cost analysis
- Compare month-over-month or year-over-year
- Professional PDFs ready to share with management
Real projects. Measurable results.
From grain farms in Limpopo to game lodges in the Greater Kruger — here's what Wild Data looks like in the field.
Centre Pivot Irrigation — Limpopo Grain Farm
A 600ha farm had four centre pivots and no way to track water remotely. A suspected valve fault was quietly wasting thousands of litres — but with no data, there was no way to confirm it.
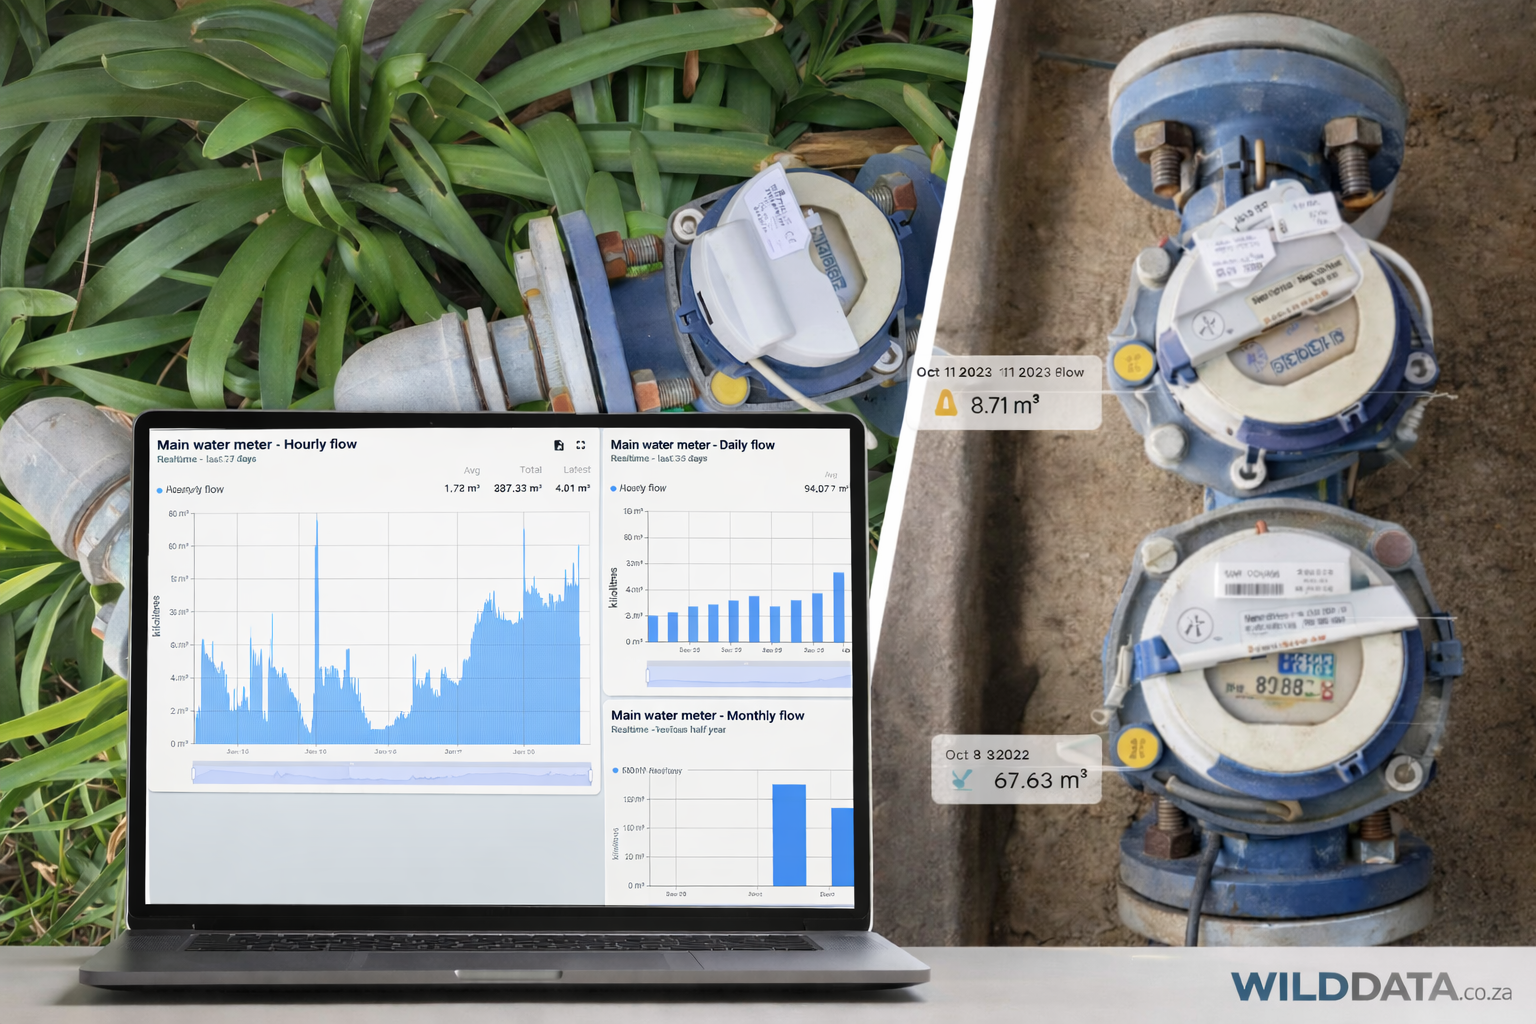
Resource Integration — Greater Kruger Game Lodge
The lodge was juggling 8 water meters on one platform, 6 energy meters on another, a third-party solar app, and manual Eskom billing. Month-end reporting took hours of manual work.
Borehole & Reservoir Monitoring — Eastern Cape Dairy Farm
Dairy cattle need water around the clock. With no remote monitoring, staff drove out multiple times daily to check reservoirs. A dry tank was always a risk nobody would know about until too late.
Water Meter Logging — Pretoria East Housing Estate
Manual meter reading across multiple residential units was slow, error-prone, and created billing disputes. Management had no visibility into leaks or individual usage patterns between reads.
Ready to discuss your project?
Tell us about your operation and what you're looking to monitor. We'll give you an honest assessment of what's possible.
We respond within 24 hours · No commitment required